Tool to calculate the grayscale histogram of an image. An histogram is a graphical representation of the distribution of colours among the pixels of a numeric image.
Image Histogram - dCode
Tag(s) : Image Processing
dCode is free and its tools are a valuable help in games, maths, geocaching, puzzles and problems to solve every day!
A suggestion ? a feedback ? a bug ? an idea ? Write to dCode!
Image Histogram
Image Histogram Generator
Answers to Questions (FAQ)
What is an image histogram? (Definition)
An image histogram is a type of statistical graph distribution of color intensities in an image. It uses the abscissa of the colors and the number of pixels for each color for the ordinate, which makes it possible to quickly evaluate the distribution of the colors within the image image.
In practice, the colors are usually limited to 255 levels of gray, the image is previously converted into grayscale (luminance).
How to compute an histogram?
Iterate over each pixel in the image and calculate the gray level of the pixel. Increment a counter corresponding to each gray level.
The histogram is the summary table of these values, which can then be displayed in graphic form.
On dCode, this work is done automatically, upload an image file (JPG, PNG, etc.) and click on Analyze.
Example: 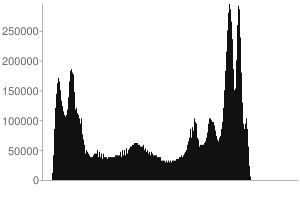
On the horizontal axis are the 256 gray/luminance values.
On the vertical axis the number of pixels in the image having this luminance value.
Why calculate a histogram?
A histogram can be used to determine whether an image is underexposed or overexposed, in order to adjust the brightness and contrast of the image.
It is potentially possible to hide information in the histogram, such as a drawing/silhouette.
Example:  has its own drawing as a histogram (Credit: joshmillard)
How to compute a grayscale value?
Histogram is based on the frequency of luminance in the image from 0 (black) to 255 (white). The luminance is computed for each pixel with the formula 0.2126*R+0.7152*G+0.0722*B (ITU BT.709).
NB: to speed up the calculations, sometimes the formula (R + G + B) / 3 is used (not recommended)
How is organised an histogram?
The colors are organized according to their tone, blacks are on the left and on the right are whites, in the middle are gray tones.
Gray levels or color values are usually normalized to a scale of 0 to 255.
How to display an Histogram in Matlab?
Use the imread function to load an image, then imhist to display its histogram.
Example: imhist(imread(image));
How to interpret a histogram to evaluate the contrast?
To assess contrast from a histogram, observe the distribution of values along the horizontal axis.
A histogram with a distribution spread over the entire range of grayscale or color indicates good contrast, while a histogram concentrated in a narrow range may indicate poor contrast.
How to differentiate an overexposed image and an underexposed image from the histogram?
An overexposed image will tend to have a histogram pushed to the right, with an accumulation of pixels towards higher grayscales or color values.
An underexposed image will show a shifted histogram to the left, with pixels mostly concentrated towards grayscale or low color values.
How to calculate lumens from the histogram?
Lumens are a measure of the total amount of visible light emitted by a light source. A histogram does not directly calculate lumens, but only the distribution of light intensities in an image. If this image is (back-)lit, then it is the power of this lighting which will provide lumens.
Source code
dCode retains ownership of the "Image Histogram" source code. Any algorithm for the "Image Histogram" algorithm, applet or snippet or script (converter, solver, encryption / decryption, encoding / decoding, ciphering / deciphering, breaker, translator), or any "Image Histogram" functions (calculate, convert, solve, decrypt / encrypt, decipher / cipher, decode / encode, translate) written in any informatic language (Python, Java, PHP, C#, Javascript, Matlab, etc.) or any database download or API access for "Image Histogram" or any other element are not public (except explicit open source licence). Same with the download for offline use on PC, mobile, tablet, iPhone or Android app.
Reminder: dCode is an educational and teaching resource, accessible online for free and for everyone.
Cite dCode
The content of the page "Image Histogram" and its results may be freely copied and reused, including for commercial purposes, provided that dCode.fr is cited as the source (Creative Commons CC-BY free distribution license).
Exporting the results is free and can be done simply by clicking on the export icons ⤓ (.csv or .txt format) or ⧉ (copy and paste).
To cite dCode.fr on another website, use the link:
In a scientific article or book, the recommended bibliographic citation is: Image Histogram on dCode.fr [online website], retrieved on 2026-06-20,
- Image Histogram Generator
- What is an image histogram? (Definition)
- How to compute an histogram?
- Why calculate a histogram?
- How to compute a grayscale value?
- How is organised an histogram?
- How to display an Histogram in Matlab?
- How to interpret a histogram to evaluate the contrast?
- How to differentiate an overexposed image and an underexposed image from the histogram?
- How to calculate lumens from the histogram?