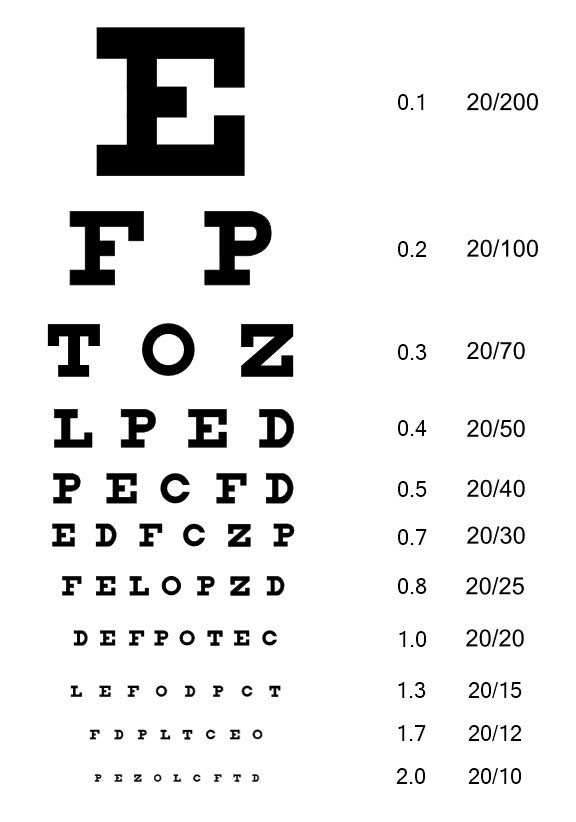
Tool to present Snellen chart, a table for assessing an individual's visual abilities with letters of different sizes.
Snellen Chart - dCode
Tag(s) : Raw Data
dCode is free and its tools are a valuable help in games, maths, geocaching, puzzles and problems to solve every day!
A suggestion ? a feedback ? a bug ? an idea ? Write to dCode!
Snellen Chart
Answers to Questions (FAQ)
What is the Snellen Chart? (Definition)
The Snellen Chart is an an optometric test to determine visual acuity of a person in ophthalmology
How to use the Snellen Chart?
The chart is intended to be used at a distance of 20 feet (about 6 meters) but can be closer if reading difficulties are presented. The person tested must open one eye at a time. The examiner/the optician randomly selects letters on each row and notes the right and wrong answers.
The score per eye is the result of the distance divided by the value of the smallest line read correctly. A visually healthy person can read the 20/20 row.
The result of the score enables to make a decision on whether or not to wear a visual correction device (glasses).
What does the numbers next to each row mean?
The second number is the distance (in feet) that a normal person (with average eyesight) can read the line.
The first number is always 20 (feet), the distance the person being tested should stand. Otherwise, replace the first number with the distance the person is located.
Example: 20/200 on the first line means that a normal person can read this line from 200 feet away (61 meters)
The values 1/10, 2/10, 3/10, up to 8/10, 9/10 and 10/10 are associated with the Monoyer chart.
How was the Snellen Chart created?
The Snellen scale uses different letters depending on the country, the principle is that they are quite easily discernible.
In the original version, the letters were
A,C,E,G,L,N,P,R,T,5,V,Z,B,D,4,F,H,K,O,S,3,U,Y,A,C,E,G,L,2
But can be different and suitable for any type of audience.
Example: C,D,E,F,L,O,P,T,Z in the above image
The size of the letters decreases on each row which makes it possible to evaluate with a fraction or a decimal number the most value read by a person tested.
What are Snellen chart's dimensions?
The table should be printed so that the first letter E is 88mm high.
When was the Monoyer Chart created?
Herman Snellen, Dutch ophthalmologist, created its table in 1862.
Source code
dCode retains ownership of the "Snellen Chart" source code. Any algorithm for the "Snellen Chart" algorithm, applet or snippet or script (converter, solver, encryption / decryption, encoding / decoding, ciphering / deciphering, breaker, translator), or any "Snellen Chart" functions (calculate, convert, solve, decrypt / encrypt, decipher / cipher, decode / encode, translate) written in any informatic language (Python, Java, PHP, C#, Javascript, Matlab, etc.) or any database download or API access for "Snellen Chart" or any other element are not public (except explicit open source licence). Same with the download for offline use on PC, mobile, tablet, iPhone or Android app.
Reminder: dCode is an educational and teaching resource, accessible online for free and for everyone.
Cite dCode
The content of the page "Snellen Chart" and its results may be freely copied and reused, including for commercial purposes, provided that dCode.fr is cited as the source (Creative Commons CC-BY free distribution license).
Exporting the results is free and can be done simply by clicking on the export icons ⤓ (.csv or .txt format) or ⧉ (copy and paste).
To cite dCode.fr on another website, use the link:
In a scientific article or book, the recommended bibliographic citation is: Snellen Chart on dCode.fr [online website], retrieved on 2026-02-02,

